A logging pipe operator for dplyr and tidyverse data pipelines.
dplyrverbs are descriptive: let’s make them more verbose!
Motivation
In SAS, every DATA step prints a log:
NOTE: There were 120000 observations read from WORK.SALES.
NOTE: 7153 observations were deleted.
NOTE: The data set WORK.RESULT has 112847 observations and 11 variables.
R’s dplyr pipelines are silent. logrittr fills that gap with %>=%, a drop-in pipe that logs row counts, column counts, added/dropped columns, and timing at every step, with no function masking.
With Fira Code ligatures, %>=% renders as a single wide arrow visually similar to %>% with an underline added, like a subtitle or, say, to read between the lines of a pipeline.
Multiple contexts
Things happens:
NOTE: There were 120000 observations read from WORK.SALES.
NOTE: 120000 observations were deleted.
NOTE: The data set WORK.RESULT has 0 observations and 11 variables.Installation
install.packages('logrittr', repos = 'https://guillaumepressiat.r-universe.dev')

# or from github
# devtools::install_github("GuillaumePressiat/logrittr")Usage
With logrittr pipe
The simplest approach – replace %>% or |> with %>=% where you want logging.
library(logrittr)
library(dplyr)
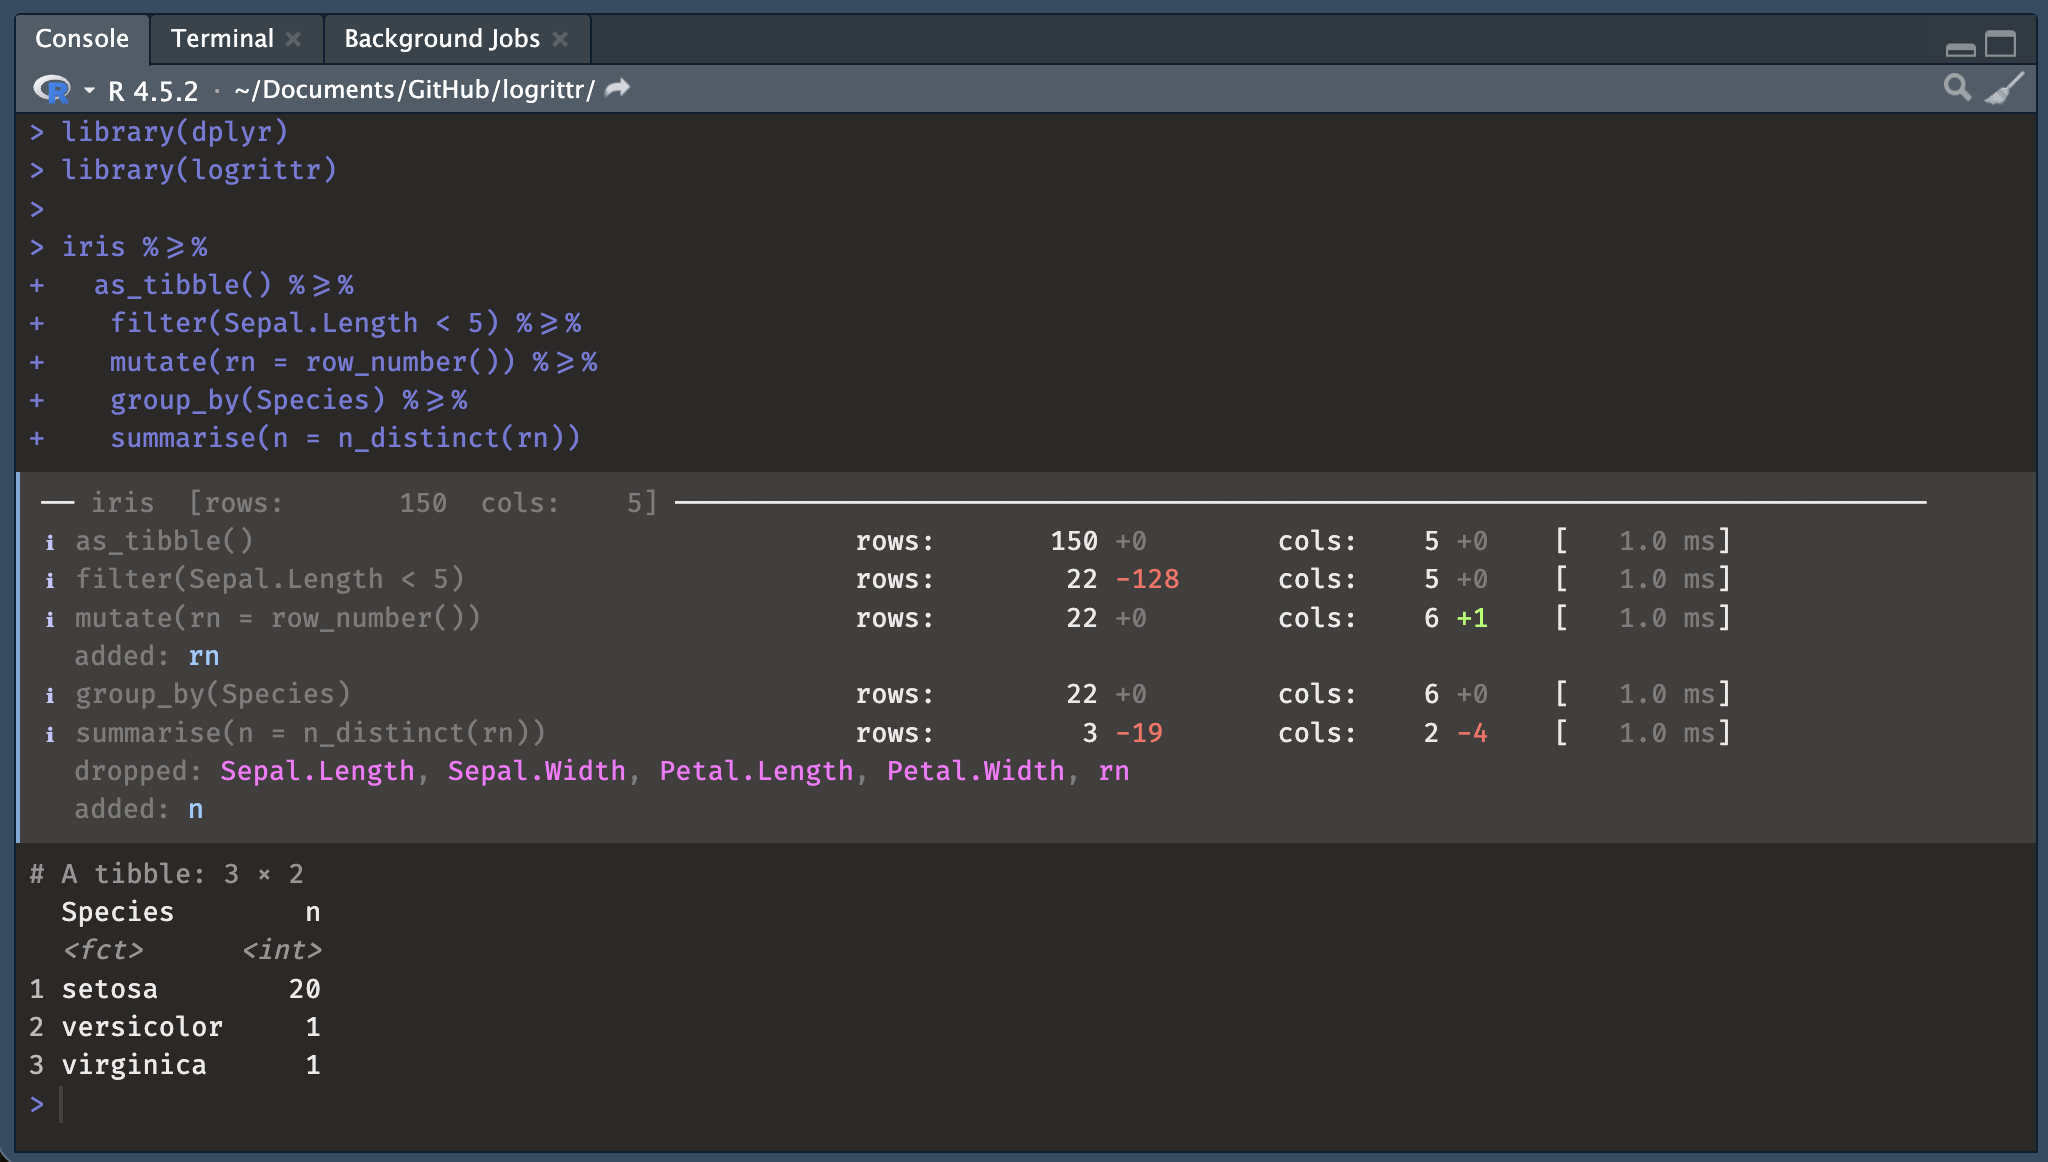
iris %>=%
as_tibble() %>=%
filter(Sepal.Length < 5) %>=%
mutate(rn = row_number()) %>=%
semi_join(
iris %>% as_tibble() %>=%
filter(Species == "setosa"),
by = "Species"
) %>=%
group_by(Species) %>=%
summarise(n = n_distinct(rn))── iris [rows: 150 cols: 5] ─────────────────────────────────────────────────────
ℹ as_tibble() rows: 150 +0 cols: 5 +0 [ 0.0 ms]
ℹ filter(Sepal.Length < 5) rows: 22 -128 cols: 5 +0 [ 3.0 ms]
ℹ mutate(rn = row_number()) rows: 22 +0 cols: 6 +1 [ 1.0 ms]
added: rn
ℹ > filter(Species == "setosa") rows: 50 -100 cols: 5 +0 [ 1.0 ms]
ℹ semi_join(iris %>% as_tibble() %>=% rows: 20 -2 cols: 6 +0 [ 5.0 ms]
filter(Species == "setosa"), by =
"Species")
ℹ group_by(Species) rows: 20 +0 cols: 6 +0 [ 3.0 ms]
ℹ summarise(n = n_distinct(rn)) rows: 1 -19 cols: 2 -4 [ 2.0 ms]
dropped: Sepal.Length, Sepal.Width, Petal.Length, Petal.Width, rn
added: nWith base R functions
%>=% also works with base R functions that return something other than a data frame — nrow, ncol, names, print, head, View, etc. Row/col counts are shown as - for those steps since there is no data frame to measure.
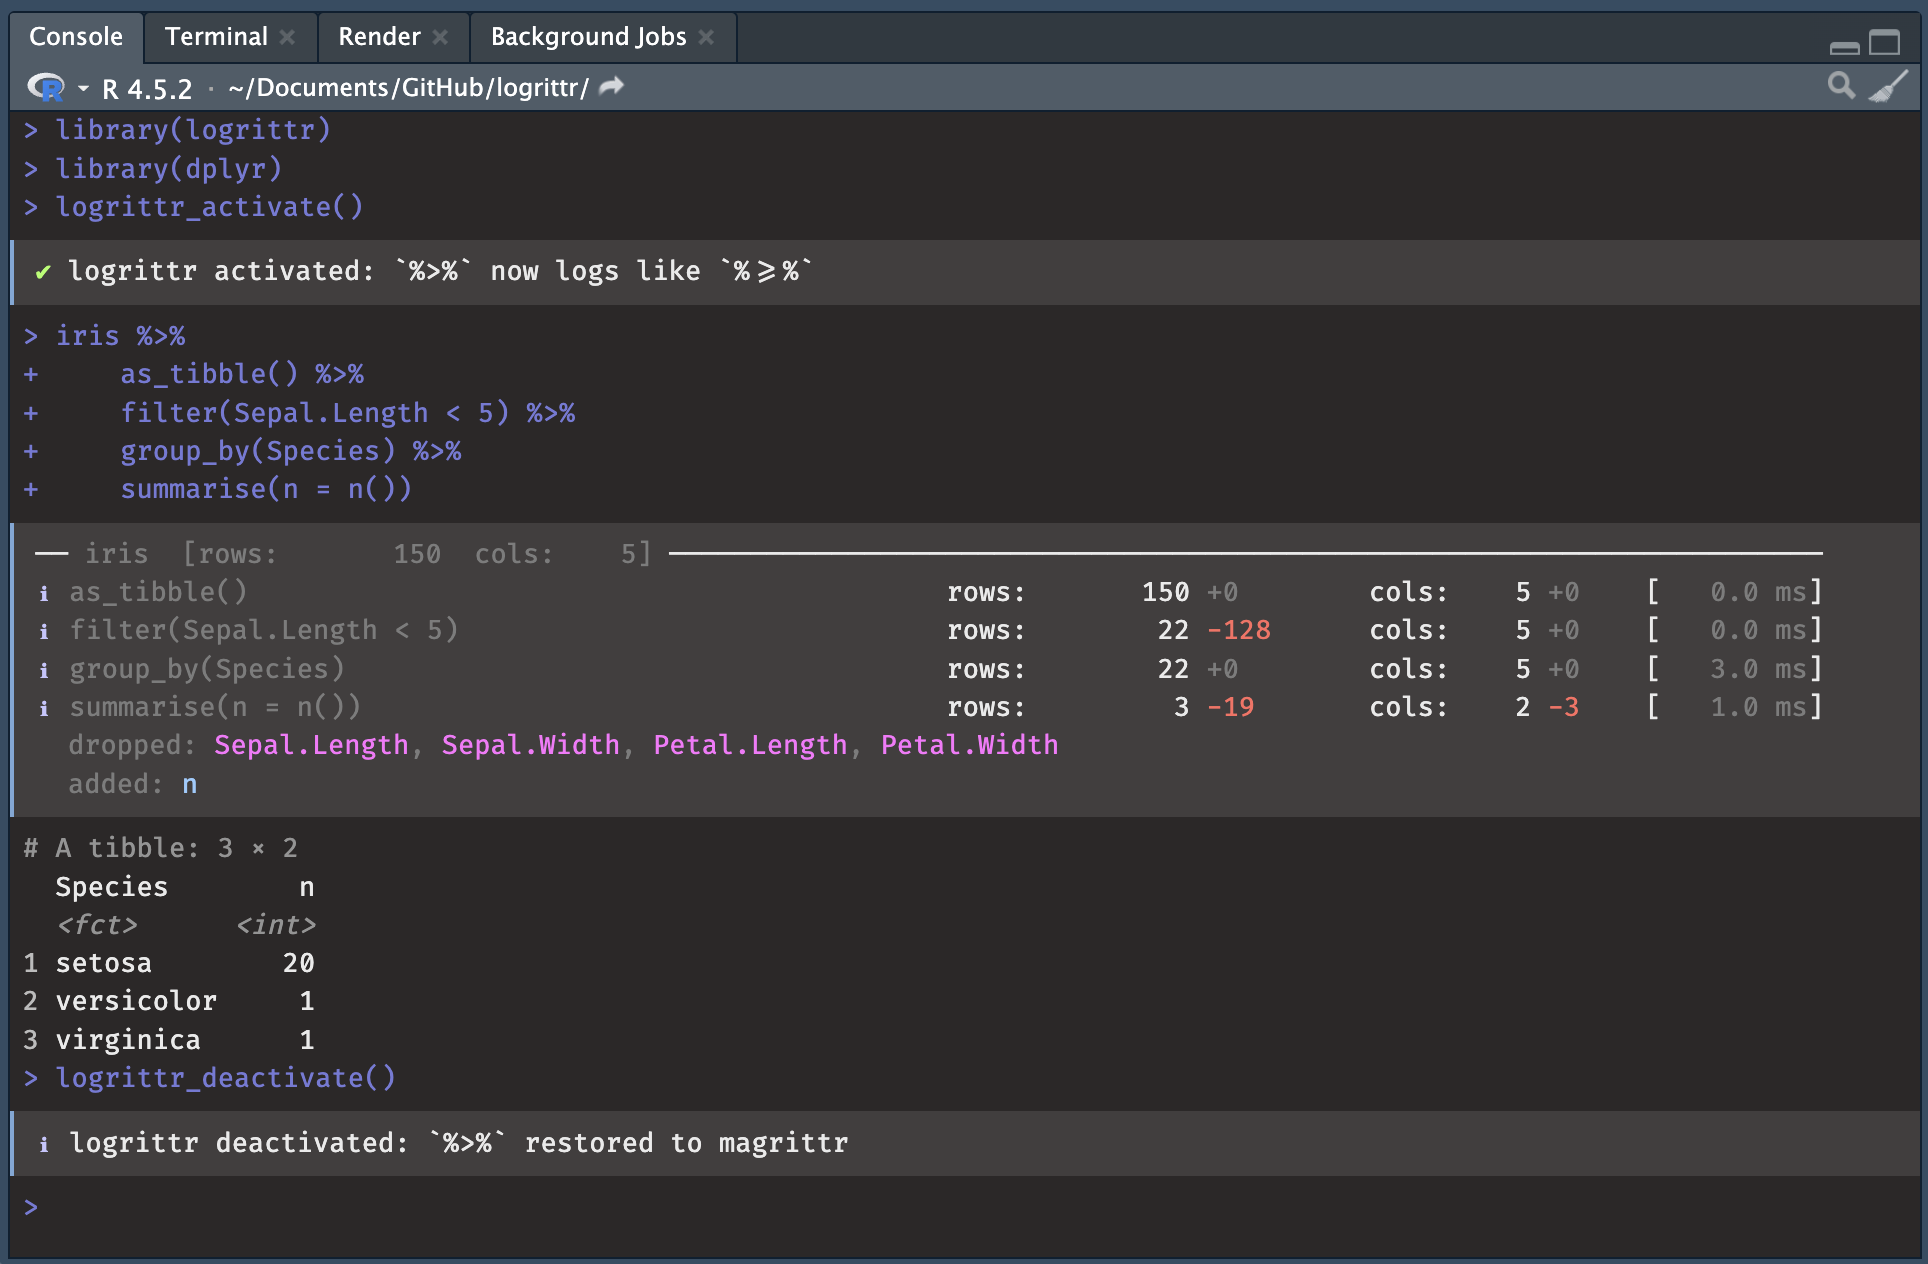
With magrittr pipe %>%
Replace %>% in the global environment with %>=% (and restore it) so existing pipelines are logged without any code change with activate / deactivate at the beginning and the end of a script / step.
In Rmarkdown or Quarto (hook)
# In your setup chunk:
library(logrittr)

knitr::opts_chunk$set(
collapse  = TRUE,
comment   = "#>",
message   = TRUE   # needed to show logrittr output (uses message())
)

# For |> pipes (opt-in per chunk with logrittr = TRUE):
logrittr_hook()
Then in any chunk you want logged (native pipe):
```{r, logrittr = TRUE}
iris |>
  as_tibble() |>
  filter(Sepal.Length < 5) |>
  group_by(Species) |>
  summarise(n = n())
```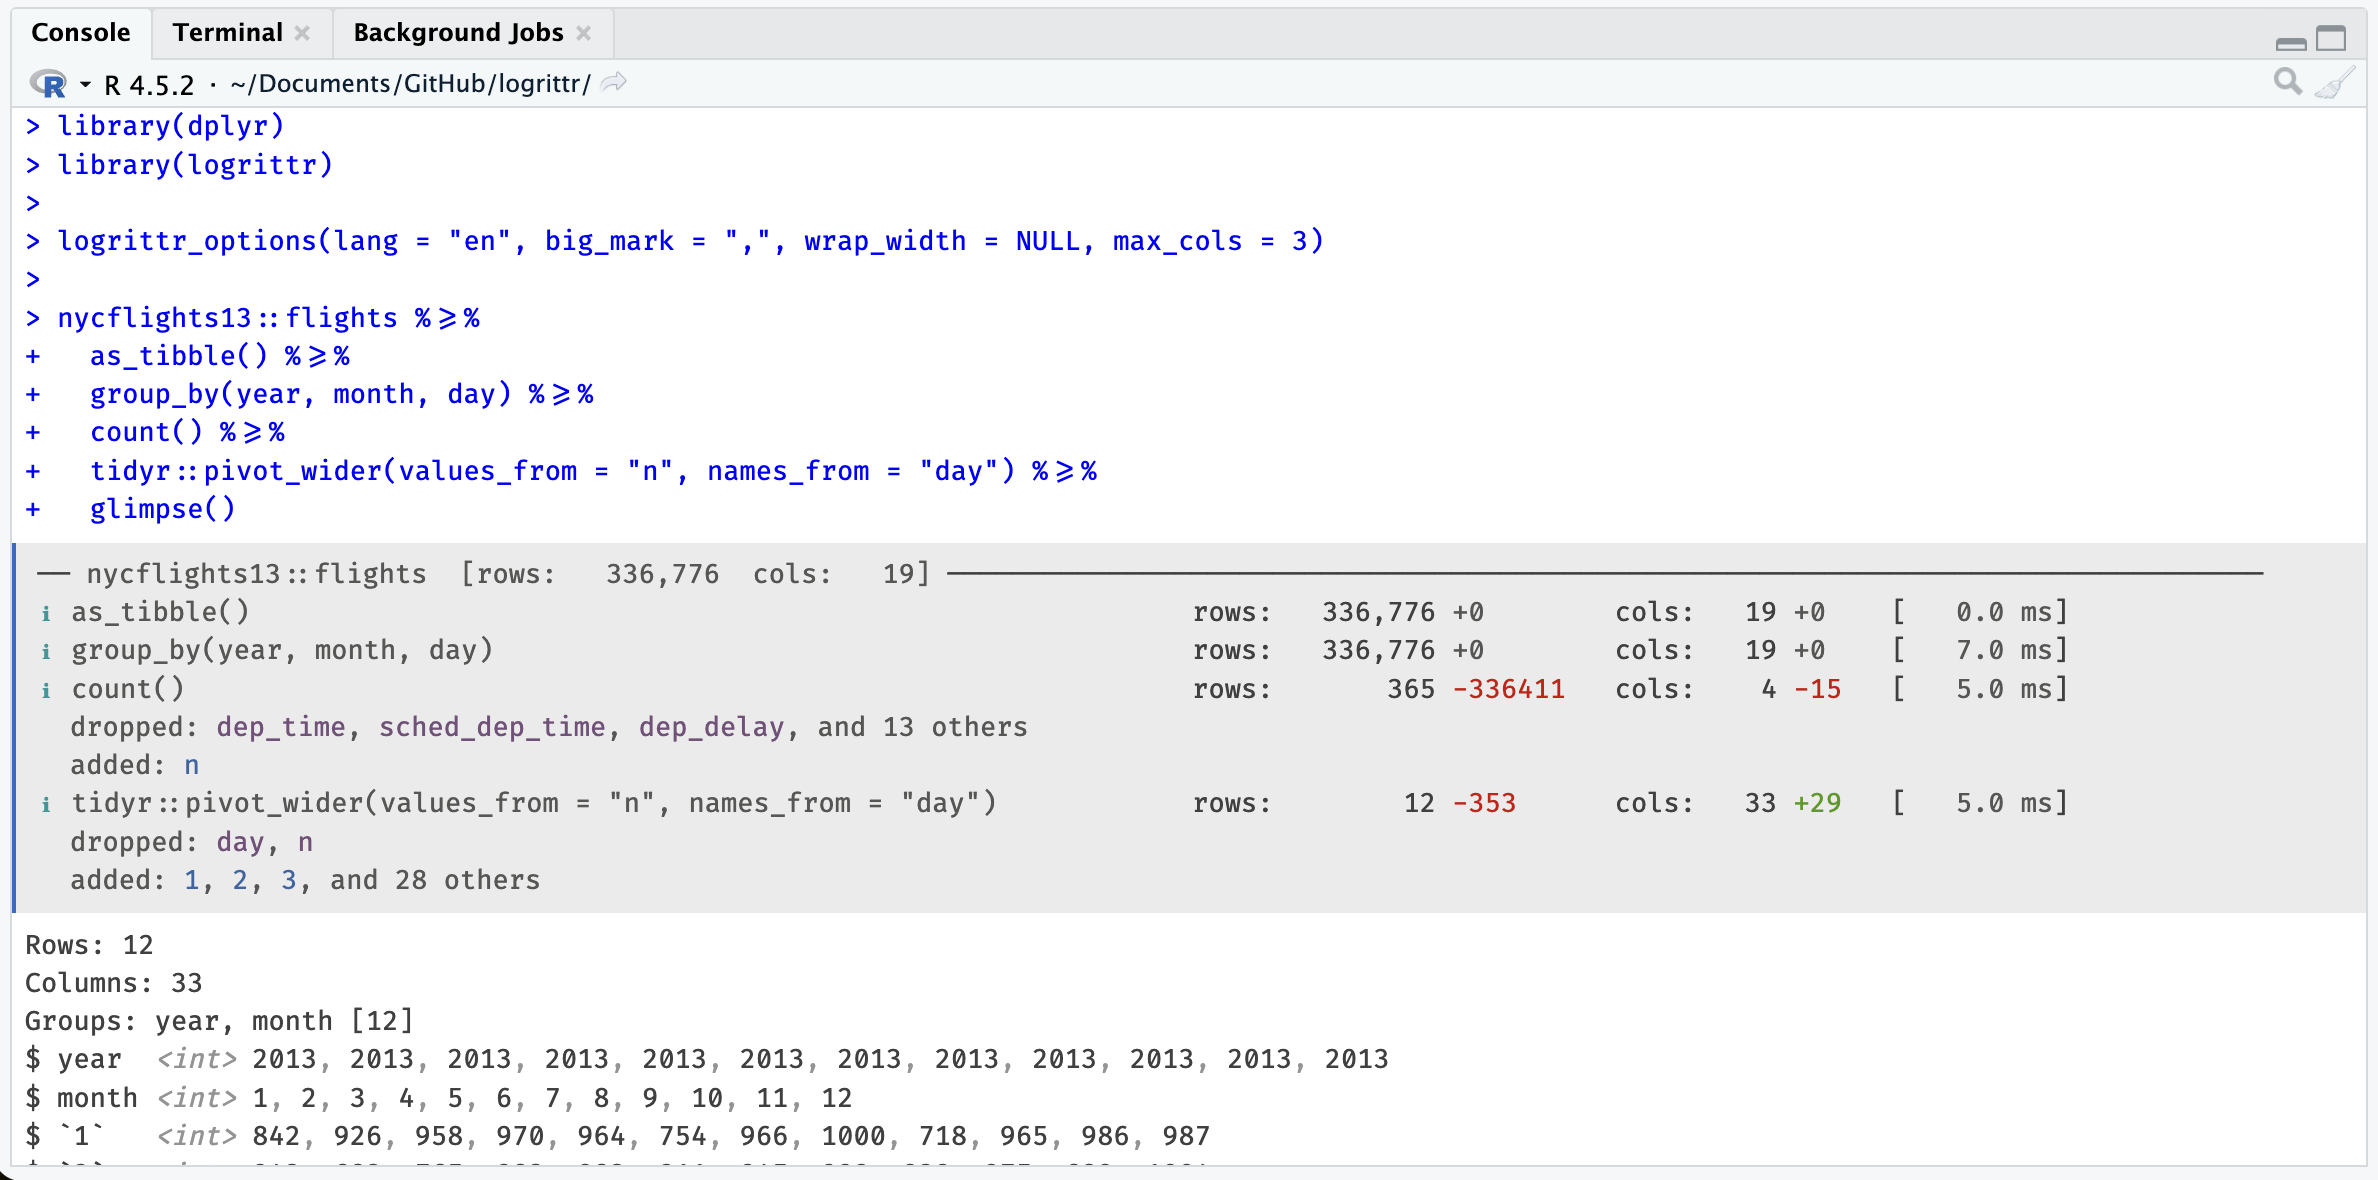
Options
# Switch to French, comma as thousands separator, wider labels
logrittr_options(lang = "fr", big_mark = "\u00a0", wrap_width = 60)

# English
logrittr_options(lang = "en", big_mark = ",", wrap_width = 52)

# Disable logging entirely (silent pipe, like plain %>%)
logrittr_options(verbose = FALSE)

# Re-enable
logrittr_options(verbose = TRUE)| Option | Default | Description |
|---|---|---|
wrap_width |
32 |
Max chars before step label wraps |
big_mark |
" " (thin space) |
Thousands separator |
lang |
"en" |
Display language: "fr" or "en"
|
max_cols |
5 |
Max column names shown in added/dropped lines |
verbose |
TRUE |
Set to FALSE to silence all logging (acts as plain %>%) |
Why not tidylog?
tidylog is a really neat package that gives me motivation for this one. tidylog works by masking dplyr functions which can cause subtle conflicts with other packages.
Anyway this also was a moment for me to test a new programmer tool that is used a lot for programming at this time.
logrittr uses a custom pipe operator and never touches the dplyr namespace. Its console output is colorful and informative thanks to the cli package.
Working with lumberjack
If you already know the lumberjack package, compatibility is available with logrittr (timings are approximates).
Calling logrittr_logger$new():
library(lumberjack)
library(dplyr)

l <- logrittr_logger$new(verbose = TRUE)
logfile <- tempfile(fileext="r.log.csv")

iris %L>%
   start_log(log = l, label = "iris step") %L>%
   as_tibble() %L>%
   filter(Sepal.Length < 5) %L>%
   mutate(rn = row_number()) %L>%
   group_by(Species) %L>%
   summarise(n = n_distinct(rn)) %L>%
   dump_log(file=logfile, stop = FALSE)


mtcars %>%
  start_log(log = l, label = "mtcars step") %L>%
   count() %L>%
   dump_log(file=logfile, stop = TRUE)


logdata <- read.csv(logfile)
Will write logrittr log content of multiple data steps in the same csv file.
Limitations
Like
tidylog, logrittr only works with dplyr pipelines on R data.frames (in memory) and is not able to do so with dbplyr pipelines from databases (remote/lazy table).Join cardinalities nicely done in tidylog are difficult to have from the pipe as join is already done, at this time we only show N row and N col evolution (before / after).
Roadmap
- Integration with the magrittr pipe
%>%vialogrittr_activate()(0.2.0) - A knitr hook for iterative steps inside Rmarkdown or Quarto (0.2.0)
-
verbose = FALSEoption to silence all logging without changing pipeline code (0.3.0) - Base R functions (
nrow,ncol,names,print,View, …) now work without errors (0.3.0)
To-do:
- Join cardinalities (get information from before / after pipe) but it has drawbacks (slow)
-
logleveloption to mute sub-pipeline steps