logrittr: A Verbose Pipe Operator for Logging dplyr Pipelines
![]()
dplyr verbs are descriptive: let’s make them more verbose!
Yet another pipe for R.
Motivation
In SAS, every DATA step prints a log:
NOTE: There were 120000 observations read from WORK.SALES.
NOTE: 7153 observations were deleted.
NOTE: The data set WORK.RESULT has 112847 observations and 11 variables.
R’s dplyr pipelines are silent. logrittr fills that gap with %>=%, a
drop-in pipe that logs row counts, column counts, added/dropped columns, and
timing at every step, with no function masking.
With Fira Code ligatures, %>=% renders
as a single wide arrow visually similar to %>% with an underline added, like a subtitle or, say, to read between the lines of a pipeline (what happened).
Multiples contexts
Things happens:
NOTE: There were 120000 observations read from WORK.SALES.
NOTE: 120000 observations were deleted.
NOTE: The data set WORK.RESULT has 0 observations and 11 variables.
“It’s here we’ve lost all rows in script execution”.
Pro
Reading this a long time after execution of a script helps you see:
- what happened at each stage of data processing without having to rerun the code, for example in a production environment where the input data is constantly changing
- monitor key processes
- Make sure you can explain what happened (an audit, for example)
In professional contexts it’s often needed.
Educational
This will also be clearer thanks to a console log for those with little experience with the tidyverse: people who are taking their first steps in programming by following a tutorial or teaching themselves.
Installation
install.packages('logrittr', repos = 'https://guillaumepressiat.r-universe.dev')

# or from github
# devtools::install_github("GuillaumePressiat/logrittr")
See github or r-universe.
Usage
library(logrittr)
library(dplyr)
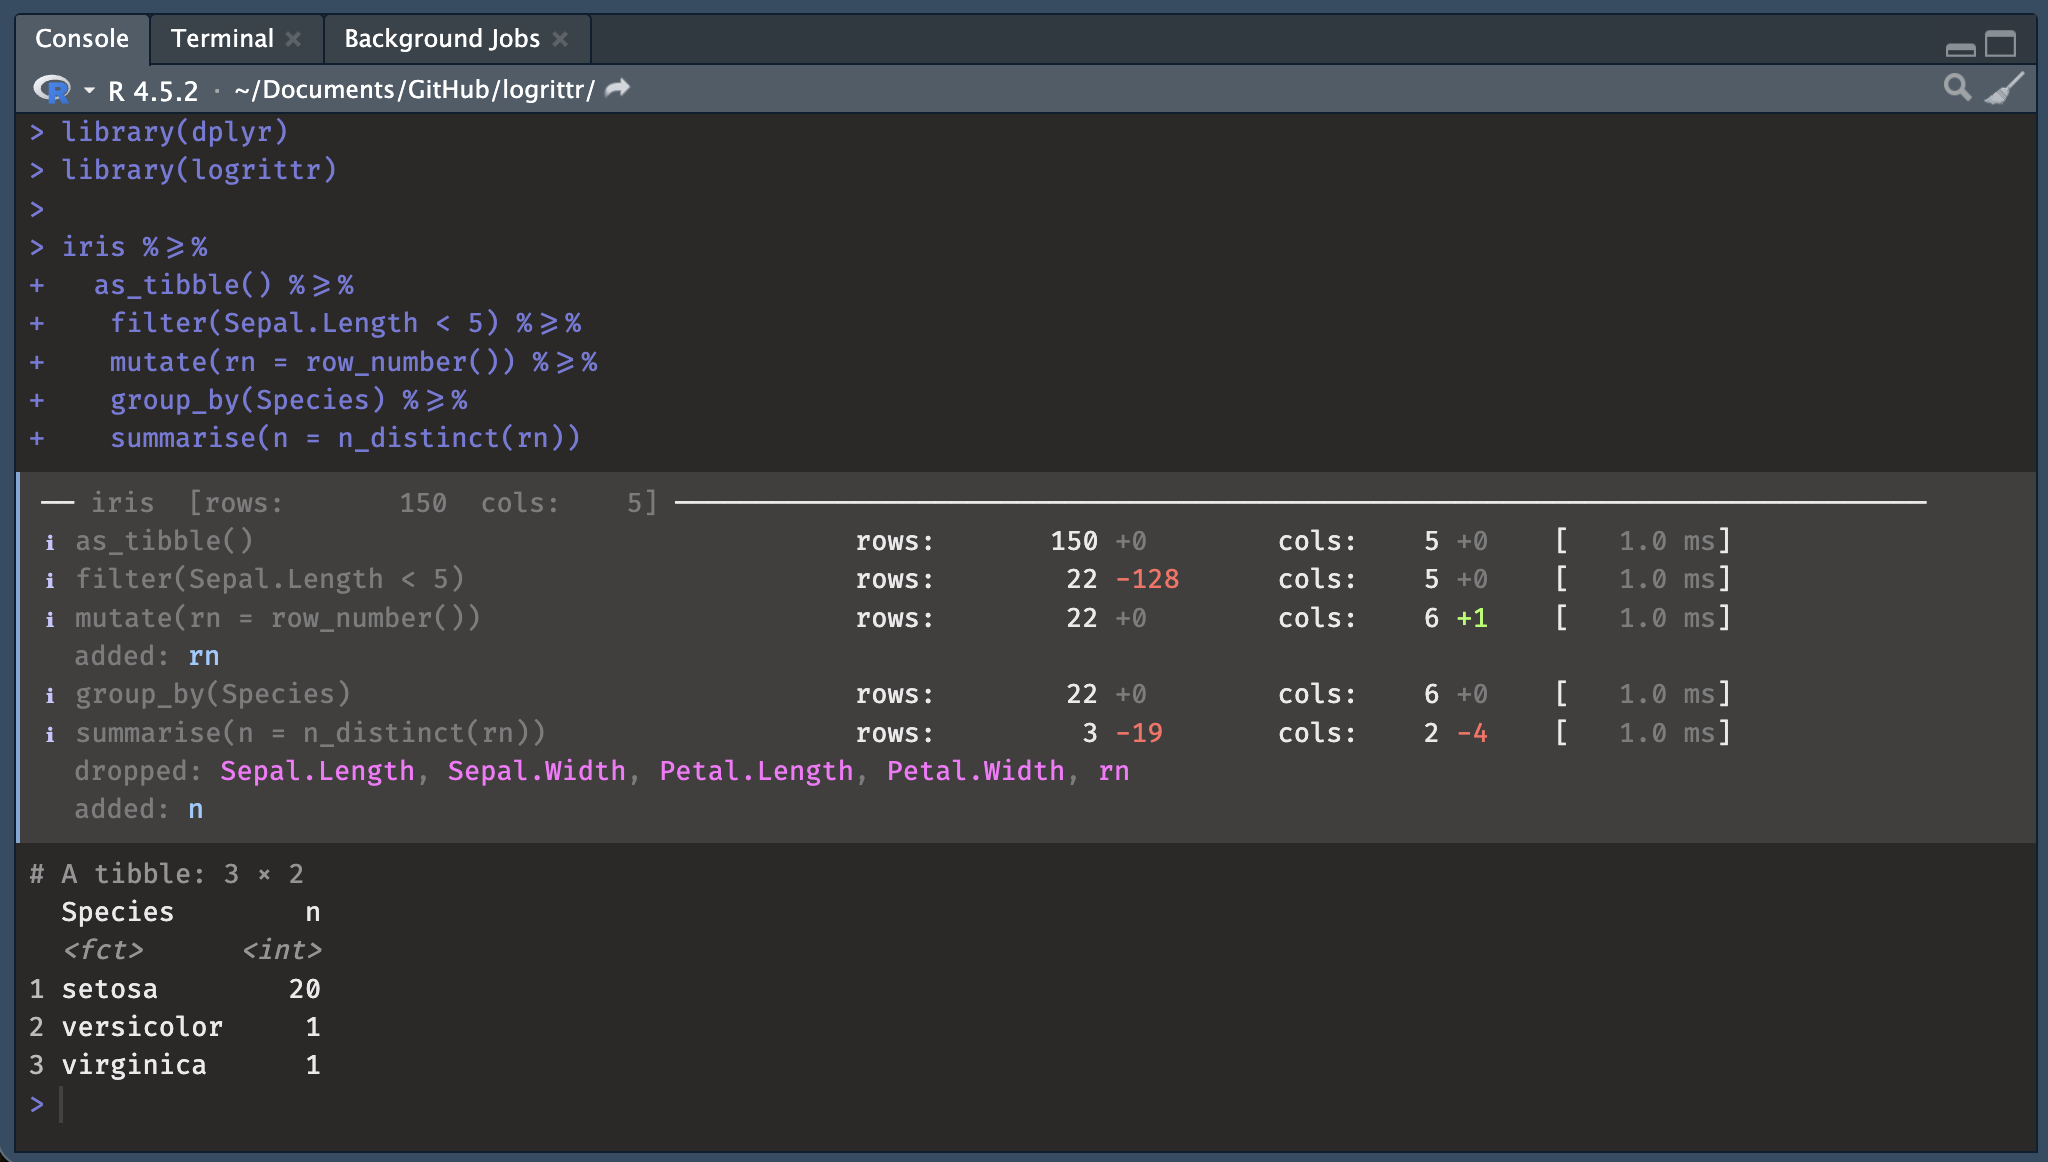
iris %>=%
as_tibble() %>=%
filter(Sepal.Length < 5) %>=%
mutate(rn = row_number()) %>=%
semi_join(
iris %>% as_tibble() %>=%
filter(Species == "setosa"),
by = "Species"
) %>=%
group_by(Species) %>=%
summarise(n = n_distinct(rn))── iris [rows: 150 cols: 5] ─────────────────────────────────────────────────────
ℹ as_tibble() rows: 150 +0 cols: 5 +0 [ 0.0 ms]
ℹ filter(Sepal.Length < 5) rows: 22 -128 cols: 5 +0 [ 3.0 ms]
ℹ mutate(rn = row_number()) rows: 22 +0 cols: 6 +1 [ 1.0 ms]
added: rn
ℹ > filter(Species == "setosa") rows: 50 -100 cols: 5 +0 [ 1.0 ms]
ℹ semi_join(iris %>% as_tibble() %>=% rows: 20 -2 cols: 6 +0 [ 5.0 ms]
filter(Species == "setosa"), by =
"Species")
ℹ group_by(Species) rows: 20 +0 cols: 6 +0 [ 3.0 ms]
ℹ summarise(n = n_distinct(rn)) rows: 1 -19 cols: 2 -4 [ 2.0 ms]
dropped: Sepal.Length, Sepal.Width, Petal.Length, Petal.Width, rn
added: nScreenshot
library(dplyr)
library(logrittr)
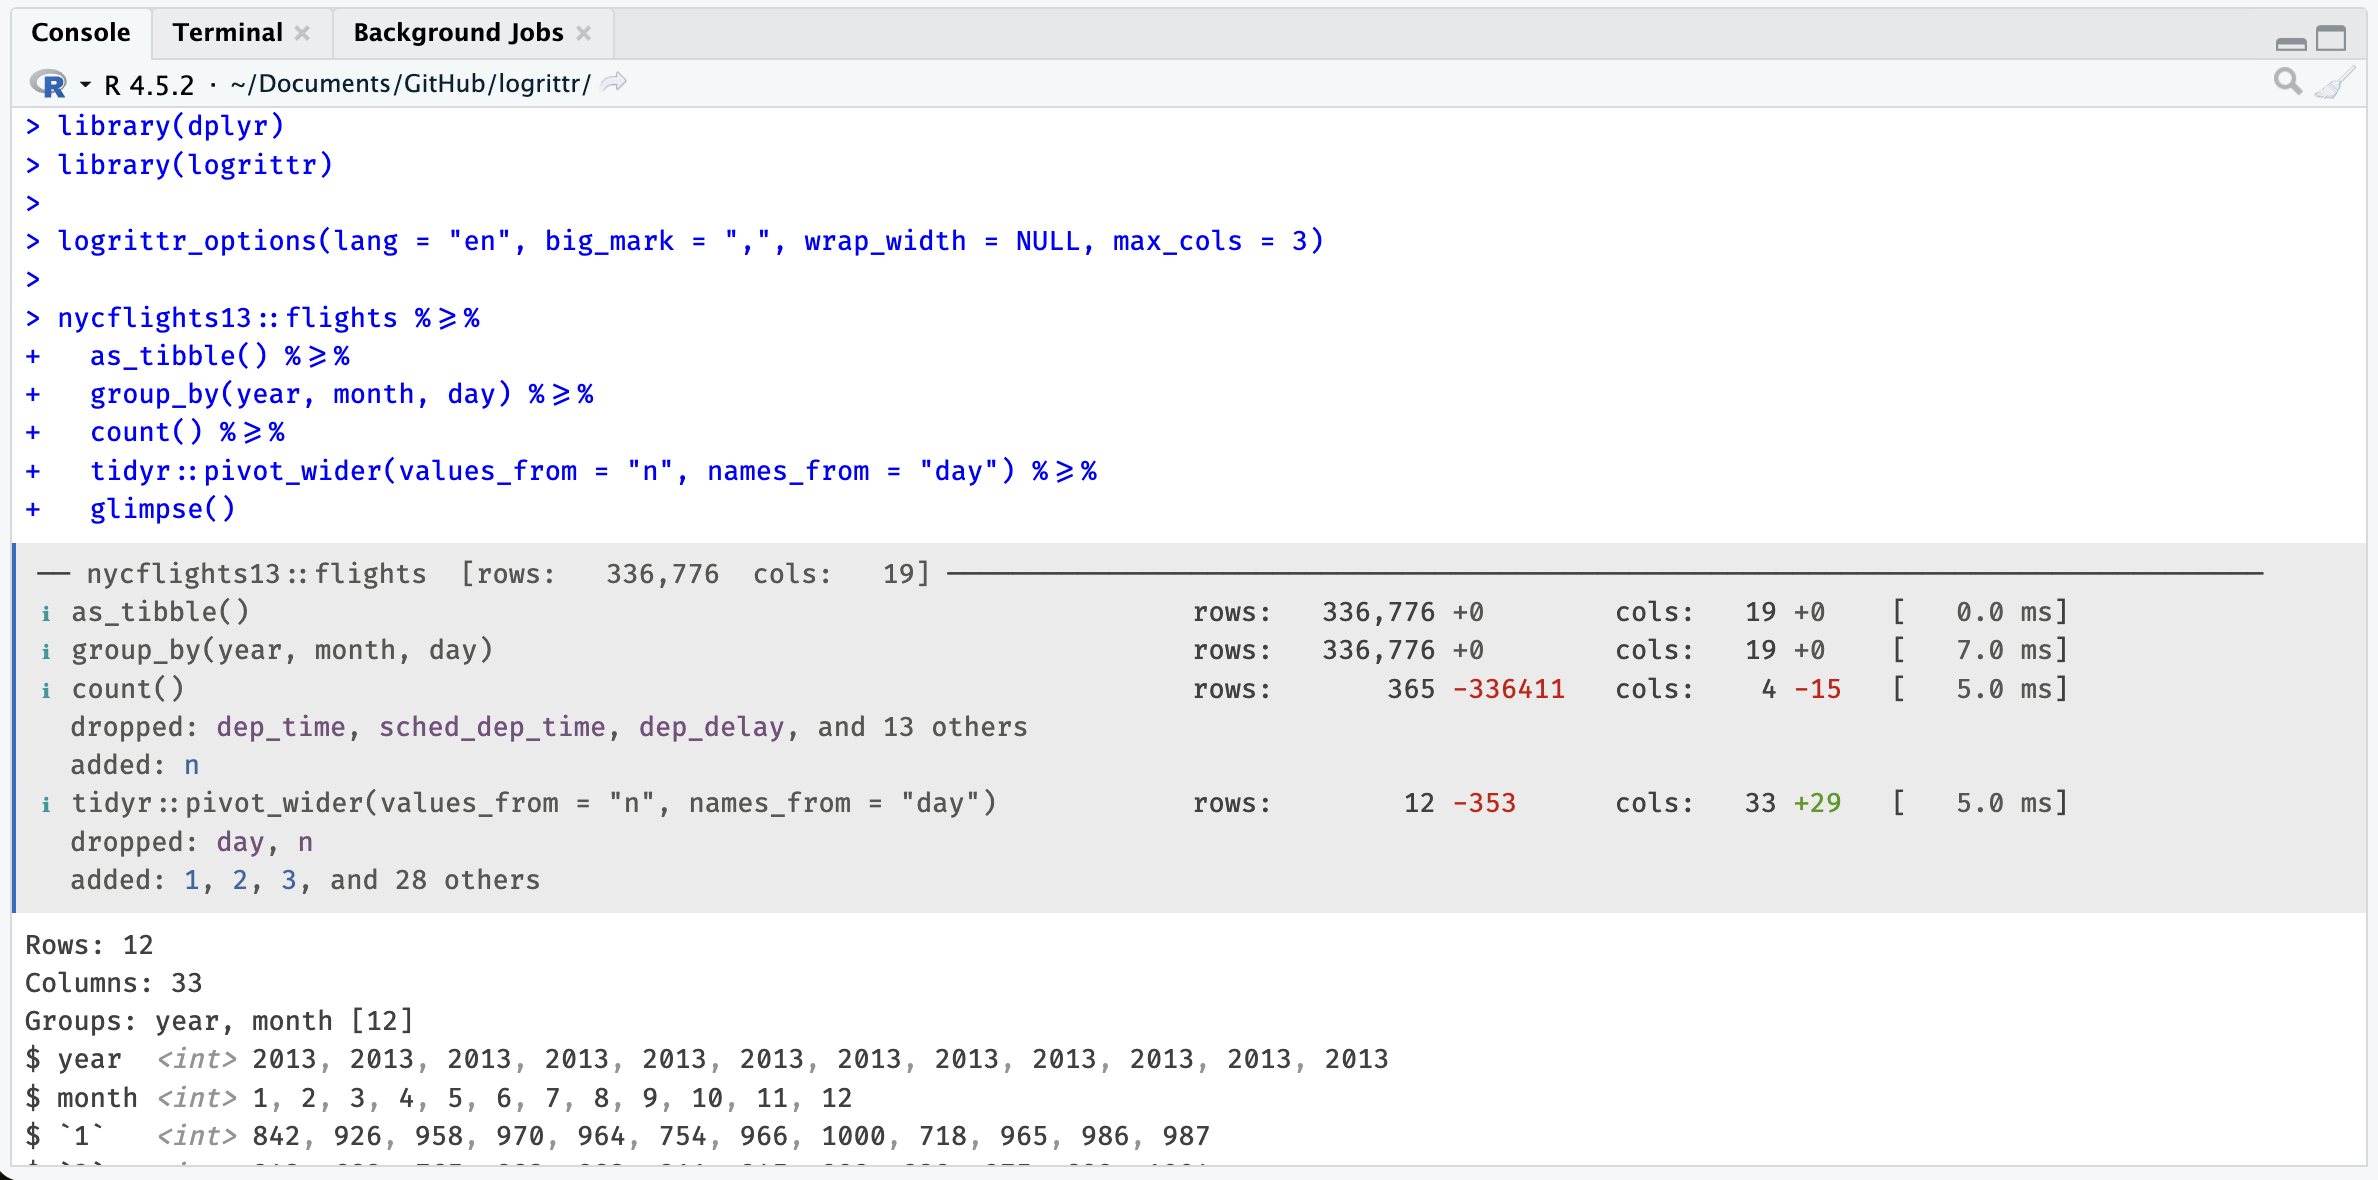
logrittr_options(lang = "en", big_mark = ",", wrap_width = NULL, max_cols = 3)
nycflights13::flights %>=%
as_tibble() %>=%
group_by(year, month, day) %>=%
count() %>=%
tidyr::pivot_wider(values_from = "n", names_from = "day") %>=%
glimpse()Related package: tidylog
tidylog is a really neat package that gives me motivation for this one.
tidylog works by masking dplyr functions, which doesn’t seem ideal to me.
Anyway this also was a moment for me to test a new programmer tool that is used a lot for programming at this time.
logrittr uses a custom pipe operator and never touches
the dplyr namespace. Its console output is colorful and informative thanks to the cli package.
Working with lumberjack
If you already know the lumberjack package, compatibility is available with logrittr (timings are approximates).
Calling logrittr_logger$new():
library(lumberjack)
library(dplyr)

l <- logrittr_logger$new(verbose = TRUE)
logfile <- tempfile(fileext=".-r.log.csv")

iris %L>%
   start_log(log = l, label = "iris step") %L>%
   as_tibble() %L>%
   filter(Sepal.Length < 5) %L>%
   mutate(rn = row_number()) %L>%
   group_by(Species) %L>%
   summarise(n = n_distinct(rn)) %L>%
   dump_log(file=logfile, stop = FALSE)


mtcars %>%
  start_log(log = l, label = "mtcars step") %L>%
   count() %L>%
   dump_log(file=logfile, stop = TRUE)


logdata <- read.csv(logfile)
Will write logrittr log content of multiple data steps in the same csv file.
Limitations
-
Like
tidylog, logrittr only works with dplyr pipelines on R data.frames (in memory) and is not able to do so with dbplyr pipelines from databases (remote/lazy table). -
Join cardinalities nicely done in tidylog are difficult to have from the pipe as join is already done, at this time we only show N row and N col evolution (before / after).
-
Yes it’s another pipe, not ideal. We can dream of a
with_logging(TRUE)context that will activate behaviour of logrittr pipe in|>or in%>%.
Take another pipe for a spin
logrittr prioritizes the user experience with a structured and colorful display in the console.
For now, this package is just a proof of concept that gave me a chance to experiment a bit with the cli package and few other things. But I think there’s a need for that in R, in a specific area where SAS outputs are so informative.