Eyes on RT-PCR tests with echarts and french open data -- COVID-19
Data on COVID-19 screening tests for France ; a shared dashboard with calendar and other heatmaps
Link for the app: https://guillaumepressiat.shinyapps.io/covid-si-dep
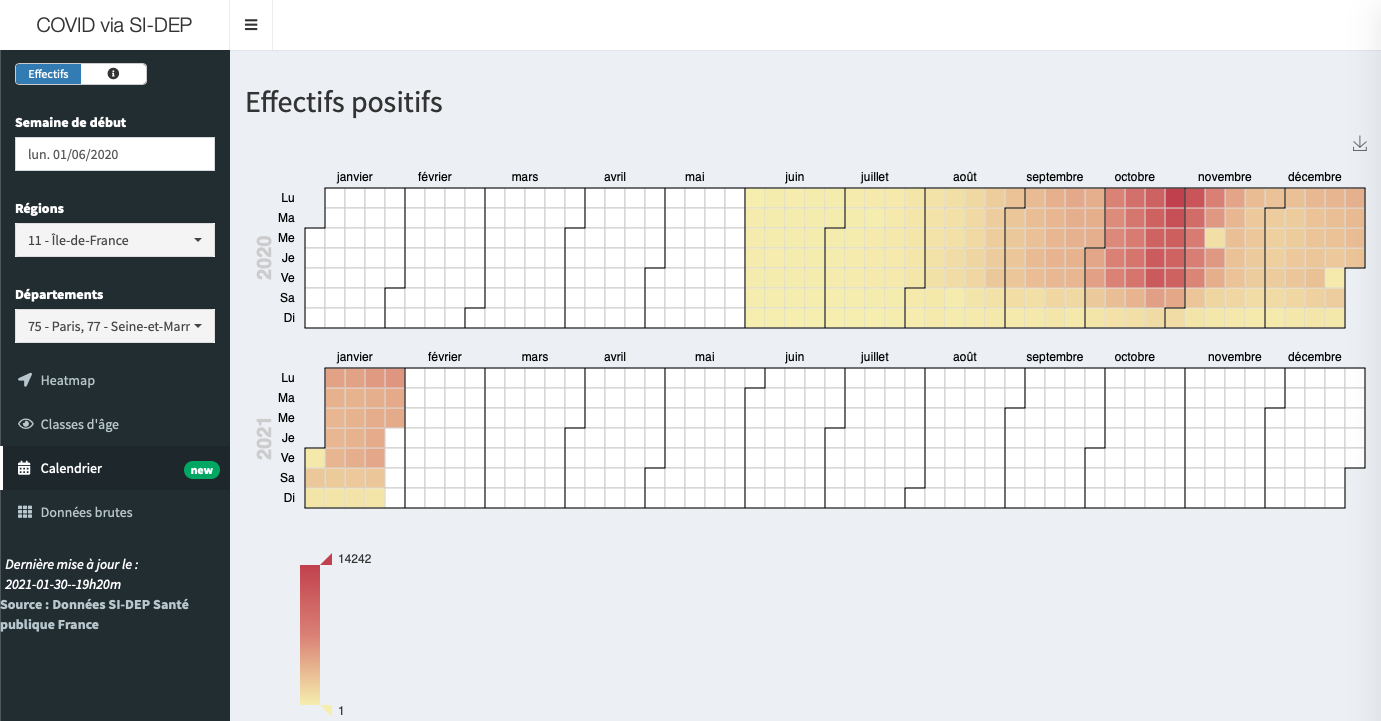
This app download daily csv file from french site data.gouv.fr via its api and build heatmaps updated with last day data available.
- I have moved from
ggplotlytoecharts4rpackage and really nicee_calendarfunction, see here: https://echarts4r.john-coene.com or here for full docs https://echarts.apache.org/ shinywidgetswithpickerInputlets user choose its departments- data are available mouse on hover
- by tweeking URL like this, you can choose which ?departments or ?regions are available on startup:
https://guillaumepressiat.shinyapps.io/covid-si-dep/?reg=11|93|32
https://guillaumepressiat.shinyapps.io/covid-si-dep/?dep=36|23|75|29
Data availables are:
- Number of positive tests by day (cases), week and departments and age categories
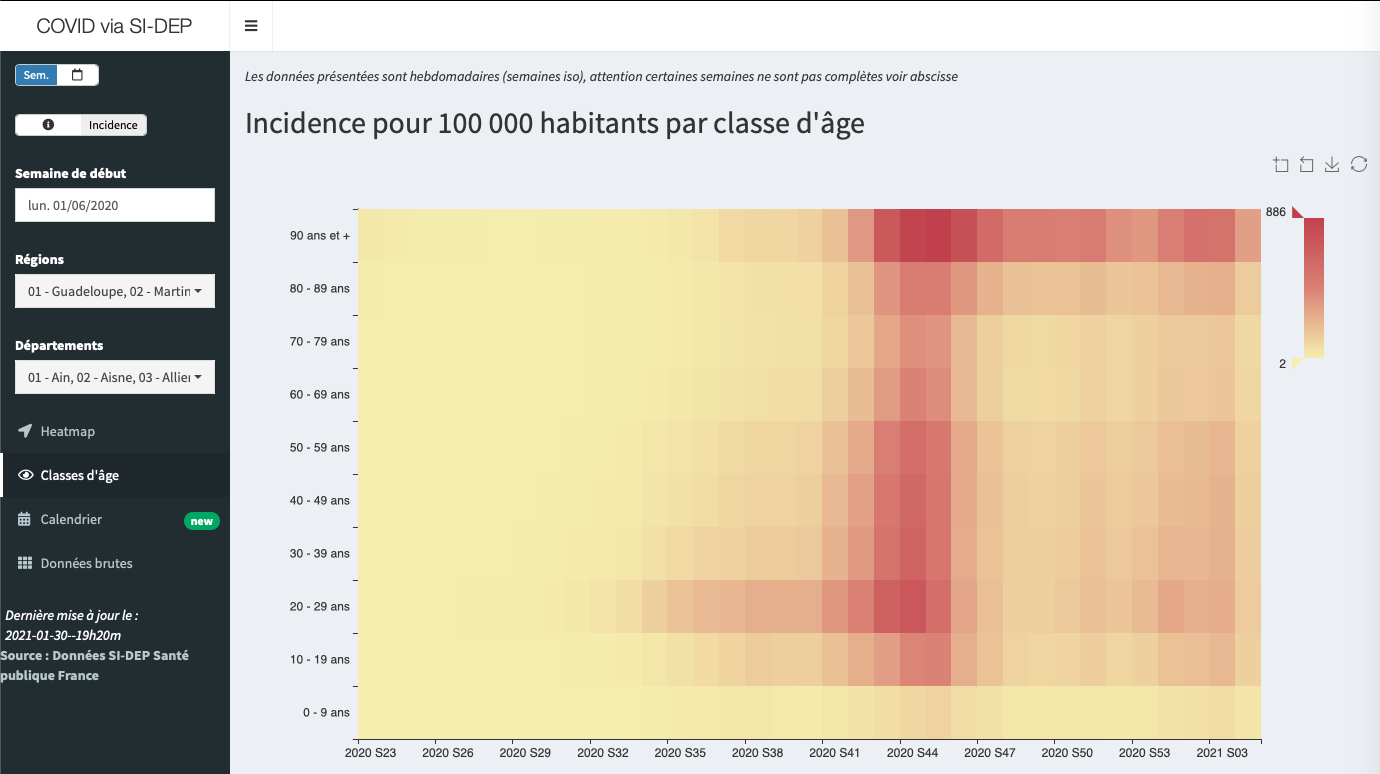
- Incidence of positive tests for 100 000 inhabitants
They come from Santé Publique France.
A visualisation is available showing dispersion over age groups by week.
Code for this app is available here.